
Photoelectron spectroscopy (PES) is an experimental method for determining the atomic and molecular electron energies. The photon, the fundamental component of light, may be used in a technique called photoelectron spectroscopy to learn more about the characteristics of various substances.
Because the data it provides is tied to the amount of energy released by the interacting electron, photoelectron spectroscopy goes by the name “photoemission spectroscopy” as well. PES is widely used in the scientific community for the investigation of elemental composition and the characterization of bonding in molecules.
What is Photoelectron spectroscopy (PES)?
Photoelectron spectroscopy is a crucial technique for investigating the energy-level structure of atoms and molecules. PES is used to determine the binding energies of electrons in compounds. In photoelectron spectroscopy, the kinetic energy of photoelectrons released after an ionization event is measured.
Photoelectron spectroscopy primarily employs a photon to interact with an electron, while other parts of the electromagnetic spectrum can also be used for spectroscopy. Photons of ultraviolet and X-ray wavelengths are the most popular for use in photoelectron spectroscopy.
The photoelectric effect, a physical phenomenon initially described by Albert Einstein in 1905, is the foundation of photoelectron spectroscopy. The photoelectric effect states that when electrons in a metal are subjected to enough radiation from light, the electrons are expelled off the surface of the metal. The energy of the electrons in the solid metal may be calculated from the kinetic energy of the expelled electrons (photoelectrons) and the energy of the incoming radiation.
Types of Photoelectron Spectroscopy
When this method has been used to surface investigations in the past, it has often been broken down into many categories depending on the origin of the exciting radiation employed.
- X-ray photoelectron spectroscopy (XPS) is a method for analyzing atomic structures that makes use of “soft” x-rays (photon energy of 200–2000 eV). In XPS, an atom in a molecule or solid absorbs the photon, causing it to ionize and release an electron from its core (inner shell).
- Ultraviolet Photoelectron Spectroscopy (UPS): the examination of valence levels using vacuum UV light (with a photon energy of 10-45 eV). UPS involves the removal of a valence electron by the interaction of the photon with the valence levels of the molecule or solid.
Principle of Photoelectron Spectroscopy
Photoemission is the process by which matter reacts to the presence of electromagnetic radiation by releasing electrons. The energy of the electromagnetic wave is transferred to the energy of the electrons, whether or not they are released. Photoelectrons are electrons whose energy is dependent on the materials and interactions inside them, making them a useful probe of material characteristics and reactions. In photoemission spectroscopy, the energy of a molecule’s photoelectrons is determined (PES).
To investigate the characteristics of various substances (gases, solids, and liquids), scientists can employ photoelectron spectroscopy, which involves the measurement of electron orbital energies. With this information, scientists can make inferences about a substance’s composition and atomic bonding. Photoemission spectroscopy is a highly accurate method for measuring electron energy. Compared to the Auger process, the basic mechanism of photoelectron spectroscopy—a single photon in/electron out cycle—is very straightforward.
For all electromagnetic radiation, the energy of a photon may be calculated using the Einstein relation:
E=hν
where,
- ℎ is Planck constant ( 6.62 x 10⁻³⁴ J s )
- ν is the frequency (Hz) of the radiation.
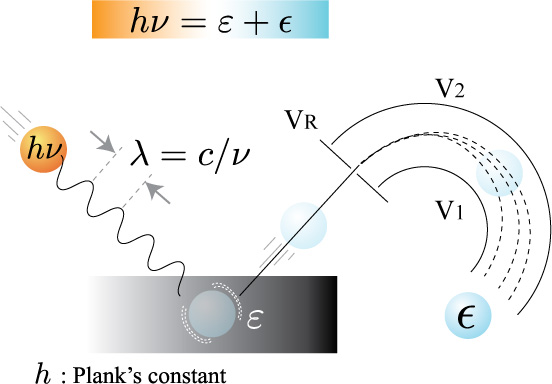
Image Source: Thai synchrotron Lab]
Any electron energy analyzer may be used to measure the photoelectron kinetic energy distribution (i.e. the quantity of emitted photoelectrons as a function of their kinetic energy) and hence record a photoelectron spectrum.
There are a number of perspectives from which to examine photoionization, and one of these is as follows:
A + hν → A+ + e−
Hence, according to the law of conservation of energy:
E(A)+ hv = E(A+) + E(e−)
This may be rearranged to provide the following formula for the photoelectron’s kinetic energy (K.E.), as the electron’s energy is only present as K.E.
K.E = hv− (E(A+) − E(A))
The following equation is often used to describe the relationship between the binding energy (BE) of an electron and the energy difference between an ionized and neutral atom.
K.E = hv − B.E
Typically, the Fermi level of the solid is used, rather than the vacuum level, to determine the binding energies (BE) of energy levels in solids.
How does Photoelectron Spectroscopy Work?
When a specific wavelength of light is focused on a sample, only a specific number of electrons will be emitted. The amount of energy emitted is proportional to the atomic energy or levels.
The photoelectron spectrum of an element can be used to:
- Identify the various atomic orbital levels.
- Discover an atom’s electron arrangement.
- A photoelectron spectrum has many peaks, each of which corresponds to a distinct orbital level where electrons might be discovered.
Photoelectron Spectroscopy Experimental Setup
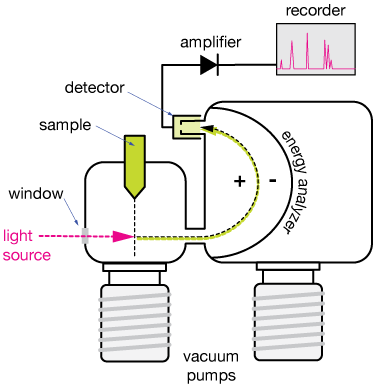
Sample
A beam of gas particles or a flat surface can serve as the sample. In this situation, particles travel in a beam that crosses the light at a straight angle.
Light source
A UV or X-ray source is used as the illumination in a PES experiment. Although helium lamps may produce ultraviolet (UV) light, their low intensity makes them unsuitable for most current studies. Instead, researchers use lasers or synchrotrons to produce UV, VUV, and X-ray light, respectively.
A vacuum chamber with a window through which the light shines. In order to avoid contamination by airborne molecules and atoms, the experiment is often conducted in a highly pressurized vacuum chamber.
Analyzer
The kinetic energy of each electron ejected from an atom as a result of the UV or X-ray light’s energy is measurable. The curving route taken by a photoelectron as it passes through the energy analyzer is depicted by the black/green dashed line. The free electrons with negative charges are guided into a detector by adjusting electric fields in an analyser. The speed of the expelled electron may be calculated by scanning the electric fields. It is possible to relate the strength of the PES signal to the number of electrons freed from a sample since free electrons are discrete particles.
Detector
When an electron strikes the detector, an electric signal is sent to an amplifier and recorded. The signal from the detector is amplified and transferred to a recording device, where it has been filtered to remove unwanted noise.
Atoms and molecules’ electronic energy levels can be determined by producing and measuring photoelectrons with varying energies by manipulating both the analyser and the light source.
Analyzing Photoelectron Spectroscopy Spectrum
Experiments on PES collect data in the form of graphs of photoelectron count vs binding energy, with the latter often reported in electron volts (eV) or megajoules (MJ) per mole.
- When plotting PES data for elements, it is common practice to have binding energy decrease toward the right along the horizontal axis, with the origin symbolizing the nucleus of the atom, to aid in our understanding of the data.
- The binding energies of the peaks in a PES spectrum vary. Each of these peaks represents a distinct subshell of an atom’s electron configuration, as all of the electrons in that subshell have the same binding energy.
- The intensity of a peak indicates the relative amount of electrons in a subshell, whereas the binding energy of a peak indicates the energy required to remove an electron from the subshell.
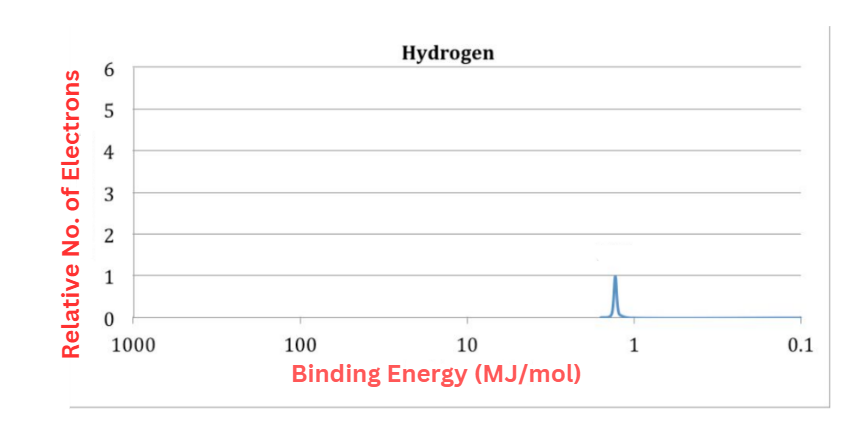
Hydrogen has only one electron, hence its photoelectron spectrum should only have one peak. The y-axis represents energy, and the value is 1.312 MJ mol-1. It is equivalent to hydrogen’s first ionization energy (1312 KJ mol-1).
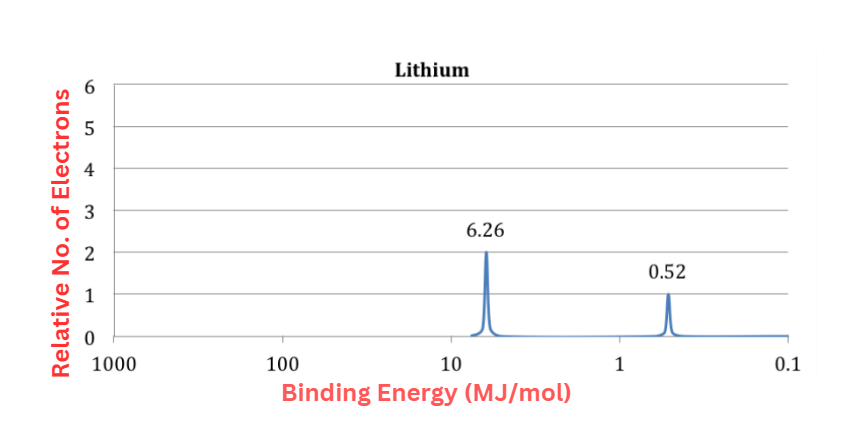
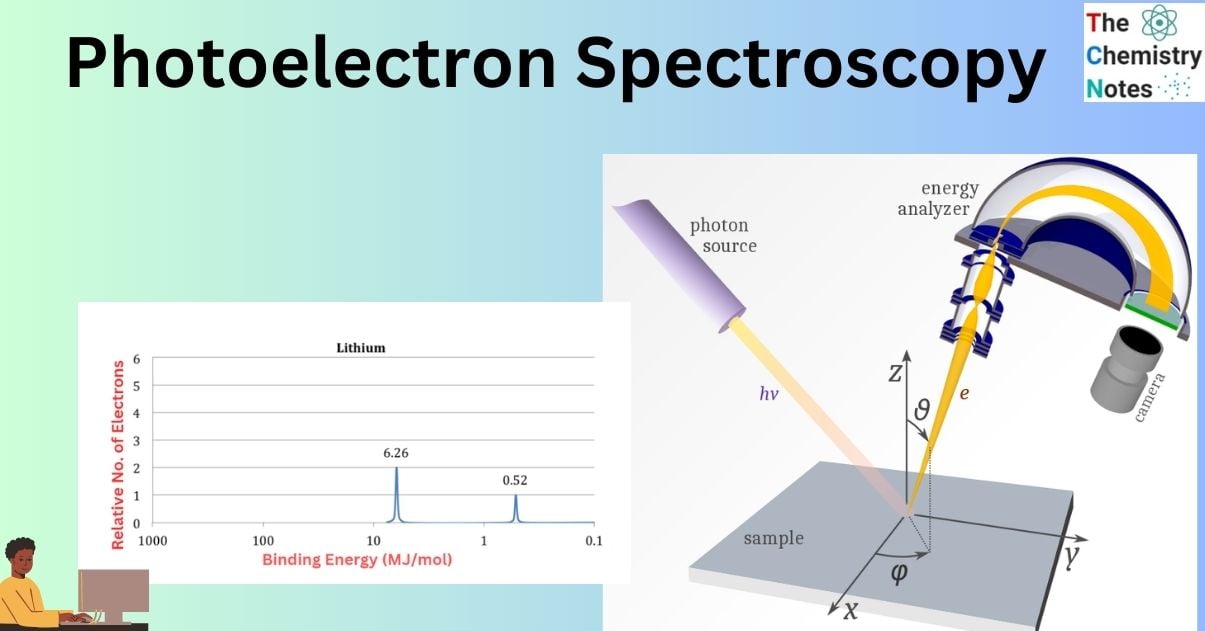
- Two peaks may be seen in the PES spectrum, which are attributed to lithium’s two subshell electrons (1s and 2s).
- The peak that is closer to the source is twice as strong as the peak that is further away.
- The peak closest to the origin must be the 1s subshell of lithium due to the disparity in electron count between the 1s and 2s subshells.
- This is in line with the binding energies, since we expect the 1s subshell electrons of Li to be closer to the nucleus and less shielded than the 2s subshell electrons. Thus, additional effort is needed to eliminate the 1s electrons. This is corroborated by the fact that the binding energy of the 1s peak in the PES spectrum is higher.
- It’s worth noting that the initial ionization energy of lithium, or the amount of energy required to remove the lithium atom’s outermost or least bound electron, is identical to the binding energy of lithium 2s peak.
- Nevertheless, the second ionization energy of lithium is not equal to the binding energy of the 1s peak. If the first electron is removed from lithium, the nucleus’s hold on the 1s electrons becomes considerably stronger, raising their binding energy
Photoelectron Spectroscopy and Its Significance
- Photoelectron spectroscopy is a powerful technique because it measures the energy of electron orbits to get insight into the physical characteristics of matter (gases, solids, and liquids).
- To deduce information about a material’s composition and the nature of the links between its atoms. One highly precise method for determining electron energy is photoemission spectroscopy.
- Core electrons are the primary focus of X-ray photoelectron spectroscopy. It can show both the individual components that compose a material and the presence or absence of connections between them.
- The electron density of states for both organic and inorganic materials may be measured by ultraviolet photoelectron spectroscopy, which is currently employed in solid state and condensed matter physics.
- In the field of condensed matter physics, the electron energy of crystalline materials are measured using angle-resolved photoemission spectroscopy.
- Ultimately, the conductivity of materials may be measured by scientists using extreme-ultraviolet photoelectron spectroscopy.
- One common use of photoelectron spectroscopy is element identification. A photoelectron spectroscope is used to irradiate the material and then analyze the resultant spectrum. There will be several peaks in this spectrum, each at a different energy level. Unknown element’s number of atomic orbitals can be inferred from its peak count. The physicist can determine the total number of atomic orbitals by counting the peaks. The scientist may calculate the number of orbitals and the sequence in which electrons occupy those orbitals using just knowledge gained from elementary chemistry.
- In the medical field, X-ray photoelectron spectroscopy can be used to ensure that a wound dressing has an adequate quantity of antibacterial silver.
- In the energy storage field, it can be used to investigate the deterioration of solar cells (phase transitions of matter and crystal nucleation).
- Many molecules in the gas phase may be characterized using ultraviolet photoelectron spectroscopy, a technique that has been utilized for quite some time.
Limitation of Photoelectron Spectroscopy
- An energetic photon must strike an electron with enough force to knock it out of its atomic orbital and into a state where its radiated energy can be measured. To remove a core electron, X-ray photons need to have energy far higher than those of ultraviolet photons, which may remove a valence electron (an electron outside of a bonded atom). As a result, the primary challenge of photoemission spectroscopy is providing the energy necessary to eject the specific species of the electron that is associated with the data of interest.
- Since the technique relies on the dislodged photoelectron making its way from the material to the detector, photoelectron spectroscopy can only provide information about the materials’ surfaces. This probability decreases as the distance the electron must travel increases.
- To function, photoelectron spectrometers need to generate just one sort of energy (either ultraviolet or X-ray photons). The spectrometers require a vacuum environment as well.
References
- Suga, S., & Sekiyama, A. (2016). Photoelectron spectroscopy. Springer-Verlag Berlin An. https://doi.org/10.1007/978-3-030-64073-6
- Pintori, G., & Cattaruzza, E. (2021). XPS/ESCA on glass surfaces: A useful tool for ancient and modern materials. Optical Materials: X, 100108. https://doi.org/10.1016/j.omx.2021.100108
- https://library.fiveable.me/ap-chem/unit-1/photoelectron-spectroscopy/study-guide/Xx7nwanr96Uzt1zSvwRA
- https://www.pnnl.gov/explainer-articles/photoelectron-spectroscopy
- Reid, K. L. (1998). Photoelectron Angular Distributions. Annual Review of Physical Chemistry, 2003(54), 397–424. http://dx.doi.org/10.1016/j.jaci.2012.05.050
- https://byjus.com/chemistry/photoelectron-spectrum/