
Fluorescence is a scientific method that involves the emission of light by a substance when it is excited by absorbing light of a specific wavelength. Spectrophotometry is a technique utilized to quantify the intensity of light emitted by a substance subsequent to its excitation by a specific wavelength of light. When substances are subjected to ultraviolet, visible, or other electromagnetic radiation, they emit fluorescence, which can be measured using a set of procedures called fluorescence spectrophotometry. The present technique is utilized for the purpose of examining the characteristics of molecules and identifying the existence of particular chemicals within a given specimen.
Fluorescence spectroscopy finds extensive utility in the fields of chemical and biological sciences, owing to its potential for investigating a biological system through the examination of its interactions with fluorescent probe molecules. Moreover, this technique is employed in chemistry to investigate the properties of molecules and to determine the identity of unfamiliar substances. The application of this technique involves the investigation of the architecture and operation of proteins and other biomolecules within the field of biological science. Within the sector of medicine, this technique is employed for the purpose of identifying the existence of markers of disease and exploring the interplay between pharmaceuticals and biological agents.
Interesting Science Videos
Fluorescence Spectrophotometry
Fluorescence Spectrophotometry depends on the phenomenon of fluorescence, which is characterized as a photoluminescent event where the emission of light occurs upon excitation by light. In layman’s terms, photoluminescence refers to the phenomenon of light emission resulting from the absorption of light. When the time between light excitation and emission is very long, we see a phenomenon called delayed photoluminescence. Here, a delay of 10-6 seconds or more is considered excessive. Fluorescence occurs when the time between excitation and emission is quite short (between 10-6 and 10-8 seconds). The emission period of fluorescence is very brief, often lasting between 1 and 10 nanoseconds. As a result, modern methods for detecting and quantifying fluorescence rely on high-tech electronics and optics.
- Fluorescence spectroscopy involves the transmission of a light beam, with a wavelength that range from 180 to 800 nm, through a cuvette that contains a solution.
- Subsequently, the emitted light from the sample is measured at an angle.
- Fluorescence spectrometry enables the measurement of the excitation spectrum, which refers to the light absorbed by the sample, as well as the emission spectrum, which is related to the light released by the sample.
- There exists a direct correlation between the concentration of the analyte and the intensity of the emission.
Fluorescence spectroscopy is a commonly employed technique for investigating alterations in the structure of conjugated systems, aromatic molecules, and rigid, planar compounds resulting from variations in environmental factors such as temperature, pH, ionic strength, solvent, and ligands. Fluorescence spectroscopy is a technique of high sensitivity owing to the ability of a solitary fluorophore to produce numerous detectable photons that can be excited and detected repeatedly.
What types of molecule exhibit fluorescence?
Fluorescent molecules and materials exhibit a diverse range of morphologies and dimensions. Certain compounds possess inherent fluorescence, including chlorophyll and specific amino acid residues such as tryptophan (Trp), phenylalanine (Phe), and tyrosine (Tyr). Certain molecules are synthesized with the sole purpose of serving as stable organic dyes or tags that can be incorporated into systems that lack inherent fluorescence. Complete collections of these items are readily accessible. Organic fluorescent molecules commonly possess aromatic rings and pi-conjugated electrons within their molecular structure. The emission range of organic dyes can extend from ultraviolet to near-infrared, contingent upon their dimensions and composition.
Several classifications of fluorescent molecules and materials include:
- Amino acids (Trp, Phe, Tyr)
- Phosphors
- Quantum dots
- Fluorescent Proteins (FPs)
- Rare earth elements (lanthanides)
- Single Walled Carbon Nanotubes (SWCNTs)
- Semiconductors
- Pigments, brighteners
- ● Chlorophylls, and so on.
How does Fluorescence spectroscopy work?
Fluorescence is a form of radiative emission that transpires when a molecule assimilates energy at a wavelength that corresponds to its transition dipole moment. The application of excitation energy to a molecule in its ground state results in the promotion of photons to an excited singlet state. Subsequently, these photons undergo decay to the lowest vibrational energy level of the aforementioned excited singlet state. The energy subsequently returns to the molecule’s ground state, resulting in the emission of photons, as illustrated in Figure below.
Fluorescent molecules have the ability to undergo three distinct methods of nonradiative relaxation, wherein the excitation energy is not transformed into photons. The three processes under consideration are internal conversion, external conversion, and intersystem crossing.
- Internal conversion is a process that takes place when there is a minimal difference in energy between two electronic states. During this process, electrons move from a higher energy state to a lower one. Energy transfer occurs to the vibrational modes of the electronic state in this context. The relationship between temperature and fluorescence intensity is inversely proportional due to the thermally driven nature of vibrational processes. Therefore, an increase in temperature results in a decrease in fluorescence intensity.
- External conversion of a fluorescence involves the loss of energy due to collisions with solute molecules in its surrounding environment, a process known as collisional quenching.
- Intersystem crossing is a phenomenon that occurs when there is an overlap in energy between the vibrational levels of the singlet and triplet excited states, leading to a transition of electrons from the lowest singlet excited state to the first excited triplet state.
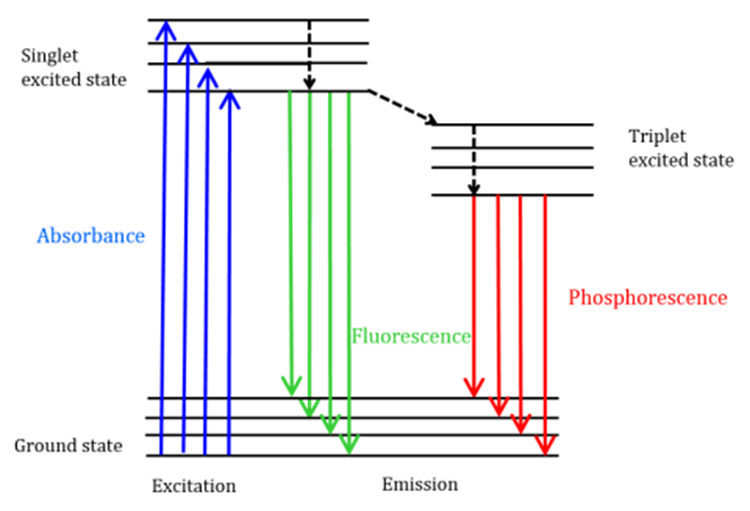
Figure: Jablonski diagram (Source: https://jascoinc.com/learning-center/theory/spectroscopy/fluorescence-spectroscopy/)
Phosphorescence, as depicted in Figure , refers to the emission of photons during the return of particles to their ground state. The phosphorescence peaks are observed at longer wavelengths than fluorescence due to the lower energy state of the triplet state in comparison to the singlet state. The prohibition of transitions results in phosphorescence displaying a comparatively lengthier lifespan (ranging from approximately 10-4 to 102 seconds) in contrast to fluorescence, which typically endures for a shorter duration (around 10-9 to 10-6 seconds). Extended lifetimes of molecules can result in thermal deactivation through various mechanisms such as oxygen quenching, solvent displacement, and intermolecular collisions. Phosphorescence is generally not observable under ambient conditions, necessitating the cooling of samples to liquid nitrogen temperatures.
Instrumentation of Fluorescence spectrophotometry
The schematic representation of the instrumentation of fluorescence spectrophotometry is depicted as:
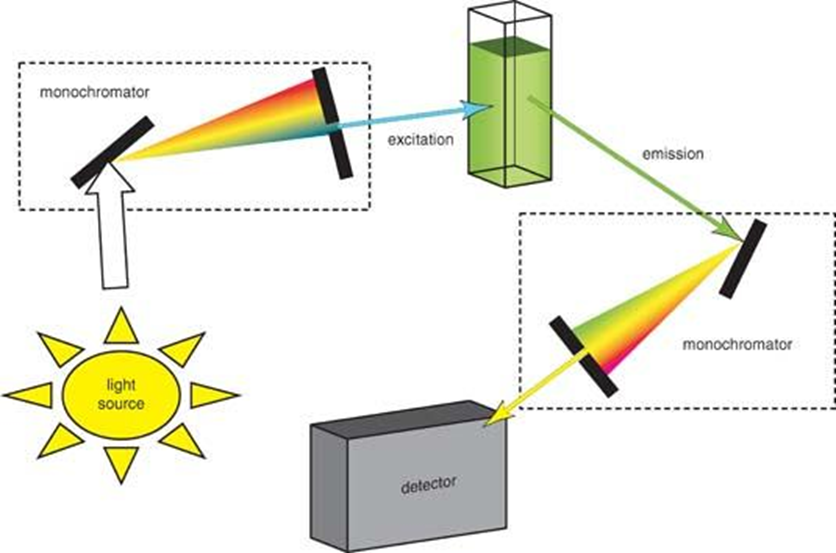
Figure: Set up of fluorescence spectroscopy (Source: https://chem.libretexts.org)
- Light sources: Light sources capable of emitting wavelengths beyond the ultraviolet and visible range possess the ability to supply excitation energy. Various light sources are available, such as arc and incandescent xenon lamps, high-pressure mercury (Hg) lamps, Xe-Hg arc lamps, low-pressure Hg and Hg-Ar lamps, pulsed xenon lamps, quartz-tungsten halogen (QTH) lamps, and LED light sources. The selection of an appropriate light source is dependent upon the specific application.
- Monochromators: Prisms and diffraction gratings are two primary forms of monochromators that are commonly employed to obtain chromatic light with a wavelength range of 10 nm, as required for experimental purposes. In the usual fashion, monochromators are assessed on the grounds of their dispersion, efficiency, level of stray light, and resolution.
- Optical filters: Optical filters are employed in conjunction with monochromators to enhance the degree of light purification. There exist two distinct categories of optical filters. The initial filter type is the colored filter, which is a conventional filter that can be classified into two distinct categories, namely the monochromatic filter and the long-pass filter. The thin film filter serves as a supplement to the former filter in various applications and is gradually replacing colored filters.
- Detector: The InGaAs array is commonly utilized as the primary detector in numerous spectrofluorometric instruments. The near-IR spectral characterization can be efficiently and effectively performed in a rapid and robust manner.
Procedure for fluorescence spectrophotometry
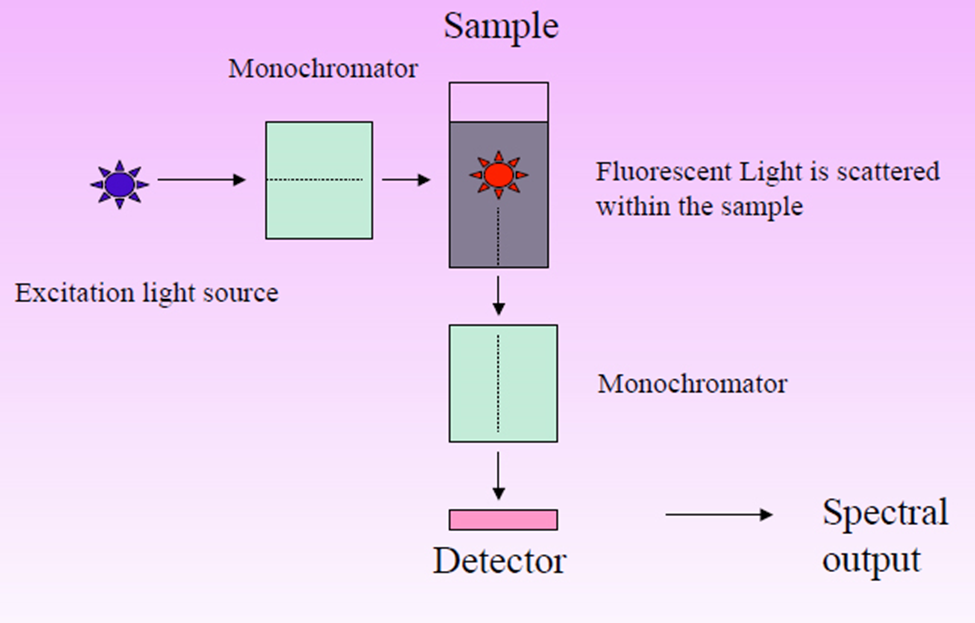
Figure: Workflow of Fluorescence spectrophotometry (Image source: https://chemistry-dictionary.yallascience.com)
- A light source, two monochromators, a sample holder, and a detector are the main components of this apparatus.
- One monochromator is used to pick the stimulation wavelength, while the other is used to analyze the emitted light.
- There is a 90-degree angle between the detector and the excitation beam.
- Upon excitation of sample molecules, fluorescence is emitted omnidirectionally and subsequently detected by a photocell positioned orthogonally to the excitation light beam.
- The lamp source that is being utilized produces radiation in the near-infrared, visible, and ultraviolet spectral ranges.
- The light is directed towards the excitation monochromator through an optical system, which enables either preselection or scanning of a specific range of wavelengths.
- The excitation light is then directed toward the sample compartment that contains the fluorescence cuvette.
- A cuvette that emits fluorescence and has sides made of translucent quartz or glass is employed.
- Upon exposure to excited light, the molecules present within the solution undergo excitation and subsequently emit light.
- The emission monochromator is designed to analyze light that is emitted at a right angle to the incident beam.
- The process of analyzing the wavelength of emitted light involves the measurement of fluorescence intensity at an already established wavelength.
- The monochromator of the analyzer is responsible for directing the emitted light’s chosen wavelength toward the detector.
- The photomultiplier tube serves as the primary detector utilized for measuring the intensity of light.
- The output current of the photomultiplier is transmitted to a measuring apparatus which provides an indication of the fluorescence intensity.
Besides these, the standard schematic diagram of the fluorescence spectrometer as per Munjana et al., 2015 is
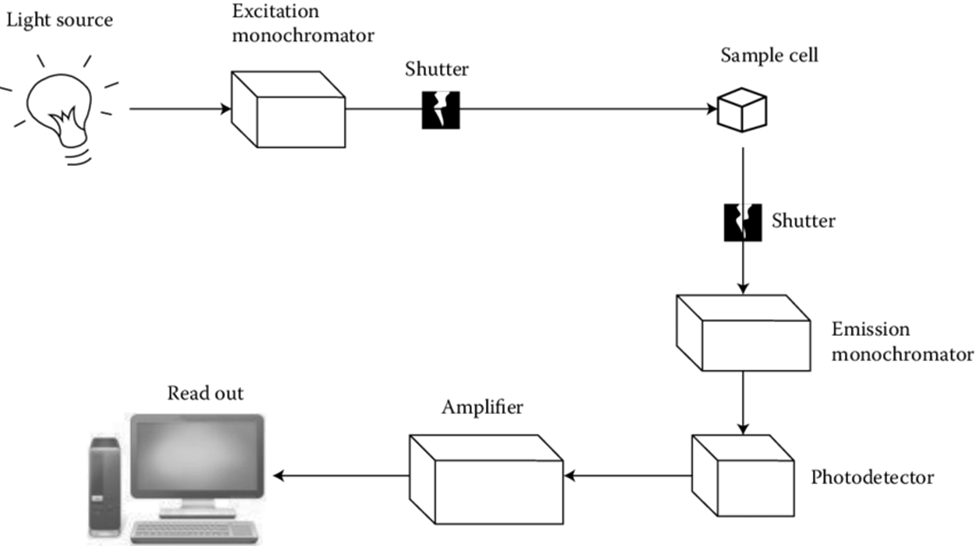
Figure: Schematic diagram of fluorescence spectrometer (https://www.researchgate.net/publication/271205275_UV-Visible_Absorption_Fluorescence_and_Chemiluminescence_Spectroscopy)
Fluorescence spectrum
Steady-state fluorescence spectra refer to the emission of fluorescence by molecules that have been excited by a continuous source of light, with the resulting emitted photons or intensity being measured as a function of wavelength. A fluorescence emission spectrum is obtained by keeping the excitation wavelength constant and scanning the emission wavelength to generate a graph of emission wavelength versus intensity.
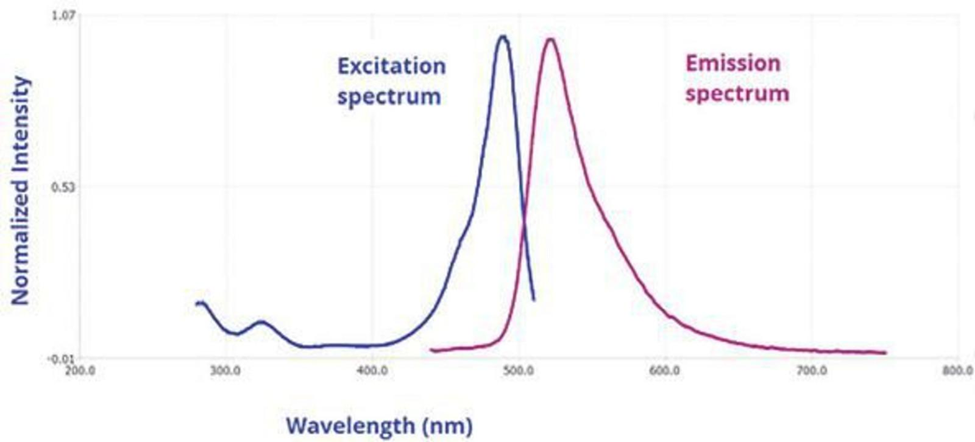
Figure: Fluorescence spectrum (Source: https://www.horiba.com)
Fluorescence excitation spectrum is when the emission wavelength is fixed and the excitation monochromator wavelength is scanned. The spectrum shows the wavelengths a sample will absorb to emit at the selected emission wavelength. Similar to absorbance spectrum, it has higher detection limits and molecular specificity. Unlike absorbance spectra, excitation spectra measure a single emitting wavelength/species. Fluorophores have mirror-image emission and excitation spectra. The emission spectrum has higher wavelengths (lower energy) than the excitation or absorbance spectrum.
The utilization of emission and excitation spectral types enables the observation of alterations in a given sample. The spectral characteristics of a molecule, including its intensity and peak wavelength, are subject to variation due to factors such as temperature, concentration, and interactions with neighboring molecules. This encompasses molecules or materials that facilitate energy transfer and quencher molecules. Certain fluorophores exhibit sensitivity towards solvent environment properties such as pH, polarity, and specific ion concentrations.
Factors affecting fluorescence spectrophotometry
- In fluorescence spectroscopy, the selection of rigid fluorophores is preferred due to their reduced vibrational motion and decreased likelihood of transitioning to a triplet state. Fluorescein and eosin exhibit rigid structures and demonstrate high luminosity, whereas phenolphthalein possesses a pliable structure and lacks fluorescence.
- The polarity of the solvent is a factor that can be utilized to determine the degree of fluorescence. The fluorescence of the structures may decrease due to the presence of heavy atoms in the solvent.
- The fluorescence emission intensity can be reduced by the presence of dissolved oxygen in the solvent. The process to accomplish this involves the photochemical oxidation of the fluorophore. The paramagnetic properties of oxygen can lead to the quenching of fluorescence.
- The fluorescence of a substance can be influenced by the pH. An example that illustrates this phenomenon is aniline, which exhibits cationic properties under low pH conditions and anionic properties under high pH conditions. Fluorescence is lost in both scenarios.
- For molecules to effectively absorb UV/vis radiation, it is necessary for them to possess π electrons, indicating unsaturation. Fluorescence is dependent upon the absorption of radiation; in its absence, fluorescence will not occur.
- Quenching is a phenomenon characterized by a reduction in the fluorescence intensity. The aforementioned outcome could potentially arise from either the absorption of fluorescence by the solution or the absorption of the fluorescent substance itself. The phenomenon under consideration is commonly referred to as self-quenching.
- Flexible structures are expected to exhibit lower fluorescence emission, while rigid structures are anticipated to exhibit higher fluorescence emission.
- Fluorescence activity is enhanced by groups that donate electrons, such as amino and hydroxyl. The fluorescence is reduced by electron-withdrawing groups, such as Nitro and carboxyl. The presence of functional groups such as SO3H and NH4+ does not have an impact on the fluorescence intensity.
- The relationship between viscosity and fluorescence intensity is such that an increase in viscosity leads to a decrease in molecular collisions, resulting in an increase in fluorescence intensity. Conversely, a decrease in viscosity leads to an increase in molecular collisions, resulting in a decrease in fluorescence intensity.
- Increased temperature results in increased molecular collisions and reduced fluorescence intensity, while lowered temperature leads to decreased collisions and increased fluorescence intensity.
Application of Fluorescence spectroscopy
Some of the major applications of fluorescence spectrophotometry are discussed below:
- Bioscience: Fluorescence spectroscopy finds extensive application in biosciences, particularly in the accurate quantification of DNA and RNA. A DNA sample is supplemented with an extrinsic fluorophore, typically ethidium bromide, and subsequently subjected to analysis using a fluorescence spectrometer to determine the concentration of the sample.
- Industrial: The implementation of fluorescence spectroscopy is prevalent in various industrial applications as a prompt and non-intrusive method for evaluating contamination. As an illustration, the technique has been employed to identify the presence of organic pollutants in subterranean water sources subsequent to hydraulic fracturing activities aimed at gas exploration.
- Chemicals: Fluorescence spectroscopy has significant chemical implications in the field of nanoparticle synthesis, particularly in the context of prospective medical applications, such as drug delivery.
- Environmental: The technique finds extensive application in fields of environmental monitoring. A prime example can be observed in the management of water in the vicinity of landfill sites.
- Pharmaceutical: Spectrofluorometry is a commonly employed analytical technique in the pharmaceutical industry for drug analysis. A specific case is related to the examination of co-formulated tablets that are administered as a means of managing cholesterol levels.
- Agricultural: Spectroscopic techniques are commonly utilized in the field of agriculture, particularly in the identification of diverse crop varieties.
- Food safety and quality control: The utilization of fluorescence spectroscopy is employed for the identification of impurities and for monitoring of the standard of comestible commodities.
- Medical diagnostics: The technique of fluorescence spectroscopy is employed for the identification of disease biomarkers in biological specimens like blood, urine, and tissue samples. Furthermore, it finds application in imaging techniques like fluorescence microscopy for investigating the spatial distribution of pathological biomarkers in biological specimens.
- Forensic science: Fluorescence spectroscopy is a scientific technique employed in forensic investigations to identify and detect minute traces of evidence.
Advantages of fluorescence spectrophotometry
- The utilization of fluorescence spectroscopy enables the detection of minute quantities of biological molecules, pollutants, and other contaminants with remarkable sensitivity, rendering it a highly suitable technique for this purpose.
- Selective detection of specific molecules or groups of molecules can be achieved through the utilization of appropriate excitation and emission wavelengths in fluorescence spectroscopy.
- The technique of fluorescence spectroscopy has the potential to detect multiple molecules at the same time by utilizing diverse fluorescent labels.
- The technique of fluorescence spectroscopy is characterized by a minimal level of background noise, thereby facilitating the identification of feeble fluorescence signals.
- The utilization of fluorescent labels in fluorescence spectroscopy enables in-vivo applications, which facilitate the monitoring of biomolecule dynamics within living organisms. This technique allows for the targeting of specific cells or tissues, thereby enabling the tracking of biomolecule movement.
- Fluorescence spectroscopy is a non-invasive analytical technique that enables the investigation of samples without causing any alteration or destruction.
- The effective use of fluorescence spectroscopy is applicable in a diverse range of fields such as chemistry, biology, medicine, environmental monitoring, and industrial analysis.
- The accessibility of fluorescence spectroscopy equipment to a wide range of researchers and scientists is facilitated by its ease of use and relatively low cost.
Disadvantages of fluorescence spectrophotometry
- Photobleaching is a phenomenon that can lead to a reduction in fluorescence signal over time in Fluorescence Spectrophotometry. This occurs when the fluorescent molecules are subjected to light and lose their fluorescence.
- Certain molecules have the ability to reduce the fluorescence of other molecules, resulting in a reduction of the fluorescence signal.
- The interpretation of fluorescence spectrophotometry outcomes can be challenging due to potential interference from various sources, including scatter, absorption, and autofluorescence.
- Certain applications of fluorescence spectroscopy require the utilization of costly reagents, such as fluorescent labels.
- The utility of fluorescence spectroscopy is limited to the detection of molecules that possess the ability to fluoresce, thereby rendering it unsuitable for the detection of all categories of molecules.
- The fluorescence signal is based upon the existence of fluorescent molecules, thereby making it unsuitable for specimens lacking such molecules.
- The dynamic range of fluorescence spectrophotometry is limited, thereby restricting its ability to detect concentrations beyond a certain range, both at the upper and lower limits.
- The application of ultraviolet radiation can induce photochemical alterations or lead to the degradation of the fluorescent compound.
- The method employed is considered inappropriate for determining the primary components of a sample owing to its decreased precision when dealing with large quantities.
- The technique’s applicability is restricted due to the fact that not all elements or compounds exhibit luminescence.
- The presence of dissolved oxygen may lead to a rise in photochemical damage.
References
- Albani, J., 2007. Principles and applications of fluorescence spectroscopy. Oxford; Ames, Iowa: Blackwell Science.
- Jacobkhed, 2002. Jablonski diagram of absorbance, non-radiative decay, and fluorescence.
- Lakowicz, J.R. ed., 2013. Principles of fluorescence spectroscopy. Springer Science & Business Media.
- Sharma, A. and Schulman, S.G., 1999. Introduction to fluorescence spectroscopy (Vol. 13). New York; Toronto: Wiley-Interscience.
- P.T. and Dong, C.Y., 2001. Fluorescence spectrophotometry. e LS.
- https://chem.libretexts.org/Bookshelves/Analytical_Chemistry/Physical_Methods_in_Chemistry_and_Nano_Science_(Barron)/01%3A_Elemental_Analysis/1.11%3A_Fluorescence_Spectroscopy
- https://jascoinc.com/learning-center/theory/spectroscopy/fluorescence-spectroscopy/
- https://www.horiba.com/int/scientific/technologies/fluorescence-spectroscopy/what-is-fluorescence-spectroscopy/
- https://doi.org/10.1007/978-0-387-46312-4