
Guillaume-François Rouelle proposed an acid-base titration in 1754 as one of the titration processes. An acid-base titration is a quantitative analysis method for determining the concentration of an acid or base by precisely neutralizing it with a known concentration standard base or acid solution. Acid and base titration is also known as neutralization titration. It employs acid-base indicators that change color to indicate the titration endpoint.
What is Acid-base Titration?
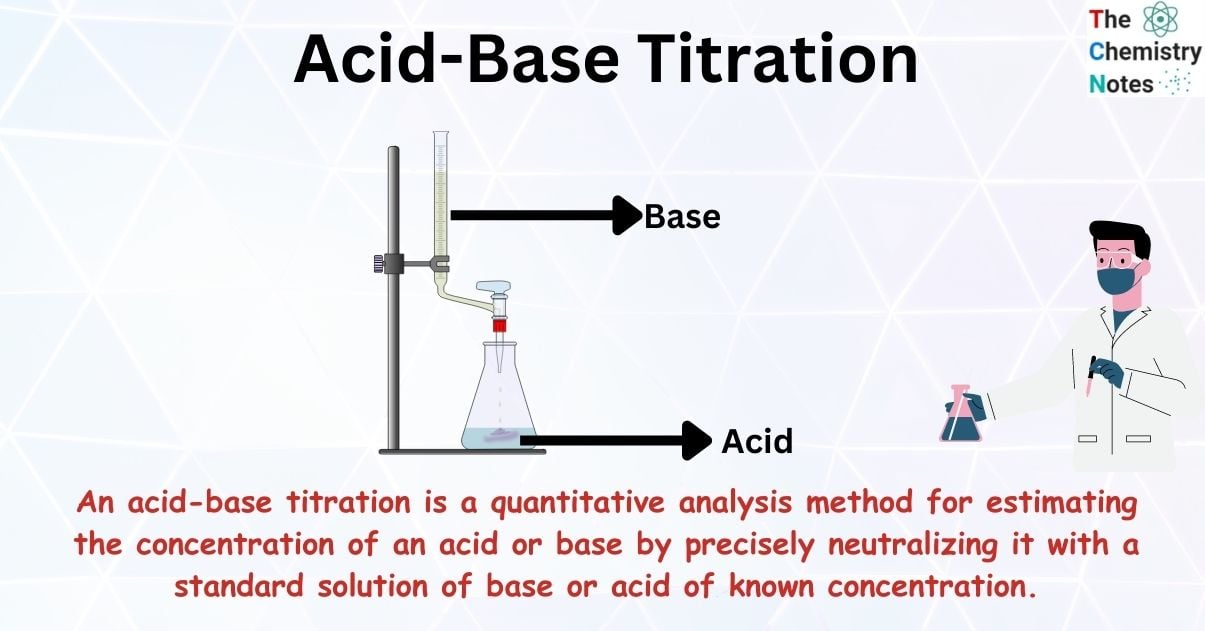
An acid-base titration is a quantitative analysis method for estimating the concentration of an acid or base by precisely neutralizing it with a standard solution of base or acid of known concentration.
Neutralization titrations are commonly used to quantify the quantities of acids and bases and to monitor the progress of processes that produce or consume hydrogen ions.
The acid dissociation constant (pKa) of the acid or the base dissociation constant (pKb) of the base in the analyte solution can be used to calculate the solution concentration (molarity). Alternatively, if the analyte solution has a known solution concentration, the pKa can be calculated by generating a titration curve. Furthermore, we investigate titration curves, which are plots of pH vs. titrant volume, and present several pH calculation examples.
- Acid-base titrations rely on the neutralization of an acid and a base in solution. In addition to the sample, a pH indicator reflecting the pH range of the equivalence point is introduced to the titration chamber.
- The acid-base indicator changes color to indicate the endpoint of the titration. The endpoint and the equivalence point are not identical since the equivalence point is dictated by the reaction’s stoichiometry whereas the endpoint is just the color change from the indicator. As a result, appropriate indication selection will limit indicator error. For example, if the equivalence point is at pH 8.4, the Phenolphthalein indicator should be used instead of Alizarin Yellow since it reduces indicator error.
- A pH meter or a conductance meter are employed when more exact readings are desired, or when the reagents are a weak acid and a weak base.
- Water is generally not a good solvent for very strong bases such as organolithium reagent, metal amides, and hydrides, therefore indicators whose pKa are in the range of aqueous pH fluctuations are of limited utility. Instead, much weaker acids are used as titrants and indicators, and anhydrous solvents such as THF are used.
Procedure of Acid-base Titration
- Step 1: Fill a burette halfway with acid. A burette is used to place the unknown concentration of acid. Burettes are favored over measuring cylinders because they are more exact.
- Step 2: Add alkali to a conical flask with a pipette. A volumetric pipette is used to transfer a fixed volume of alkali standard solution into a conical flask. This method is also more accurate than a measuring cylinder.
- Step 3: To the alkali, add an indicator. An indicator is added to the alkali in the conical flask, causing it to change color.
- Step 4: Gradually incorporate the acid into the alkali. The acid from the burette is allowed to run into the alkali, with regular spinning to ensure that the reactants combine well.
- Step 5: Reduce the rate of acid addition when the indicator changes color. When the color of the indicator changes, the flow of acid is slowed, allowing it to be added drop by drop.
- Step 6: When there is a lasting color change, stop adding acid. When the indicators color undergoes a permanent change. The flow of acid has been stopped.
- Step 7: Make a note of the titre. The titre, or volume of acid supplied, is noted.
- Step 8: Titrate once more. The titration is repeated until the titres are concordant (within 0.1 cm3).
Types of Acid-base Titration
Titrations of acids and bases with unknown concentrations are performed using a standard acid or alkali solution. Using a reference acid solution, acidimetry calculates the concentration of an alkali solution. Similarly, alkalimetry uses a reference alkali solution to estimate the concentration of an acid solution.
Acid-base titrations are classified into the following classes based on the strength of the acids and bases:
- Strong acid-Strong base
- Weak acid-Strong base
- Strong acid-Weak base
- Weak acid-Weak base
Strong Acid-Strong Base Titration
From a trial standpoint, this is one of the less complex acid-base titrations. Strong acid and strong base are separated in water, resulting in a strong acid-strong base balance mechanism. The proportionality point is reached when the moles of acid and base are equal and the pH equals 7.00.
For example: Titration of hydrochloric acid (strong acid) with sodium hydroxide (strong base) to produce sodium chloride and water is one such example.
Weak Acid-Strong Base Titration
In this type of titration, protons are transported directly from the weak acid to the hydroxide particle. When a weak acid (acetic acid) reacts with a strong base (NaOH), the acid and base react in a coordinated proportion. At the neutral point of a weak acid-strong base titration, the pH is greater than 7.
For example: Acetic acid (CH3COOH) titration with NaOH. During this titration, the acetic acid derivation particle (CH3COO–) is formed when the OH– neutralizes the H+ from acetic acid. Water reacts with this form basis to produce an essential arrangement to some extent.
Strong Acid-Weak Base Titration
In this type of titration, the acid and base should react to form an acidic arrangement. During the titration, a type of acid is formed, which subsequently reacts with water to form hydronium particles. At the proportionality point of a strong acid-weak base titration, the pH is less than 07.00.
For example: Titration of hydrochloric acid (strong acid) into smelling salts (weak base), resulting in acid ammonium and an acidic arrangement.
Weak Acid–Weak Base Titration
Unlike strong acids and bases, the condition of a weak acid’s or alternately base’s titration bend is heavily influenced by the acid’s or alternately base’s personality and the connected acid ionisation constants (Ka) or base ionisation constants (Kb). When titrating a weak acid or weak base close to the equality point, which is greater than 07.00 individually, the pH changes much more slowly.
For example: Ethanoic Acid and ammonia
Acid-base Indicators
An acid-base indicator is a weak acid or weak base that changes color as the concentration of hydrogen (H+) or hydroxide (OH–) ions in an aqueous solution changes. Acid-base indicators are commonly used in titrations to determine the endpoint of an acid-base reaction.
Acid-base indicators are substances that change color or become turbid at a given pH. In addition to determining the equivalence point, they measure pH. They change color dramatically, are soluble, and can be acids or bases. They use organic cosmetics. An electron isomerism resonance causes the color change. Because different indicators have different ionization constants, they change color at different pH intervals.
Litmus is the most well-known pH indicator. Acid-base indicators include thymol blue, phenol red, and methyl orange. Red cabbage can also be used as a sign of acid-base balance. Acid-base indicators can be organized into three broad categories:
- The phthaleins and sulphophthaleins (example-phenolphthalein indicator)
- Azo indicators (example- methyl orange indicator)
- Triphenylmethane indicators (example- malachite green indicator)
Selection of Indicators for Acid-base Titration
When choosing an indicator for an acid-base titration, there are various things to consider:
The pH range of titration: The indicator should change color inside the titration’s pH range. For example, if a strong acid and a strong base are employed in the titration, the pH range will be wide, and an indicator with a wide range, such as bromothymol blue, can be utilized. If a weak acid and a strong base are employed in the titration, the pH range will be small, and an indicator with a narrow range, such as phenolphthalein, can be utilized.
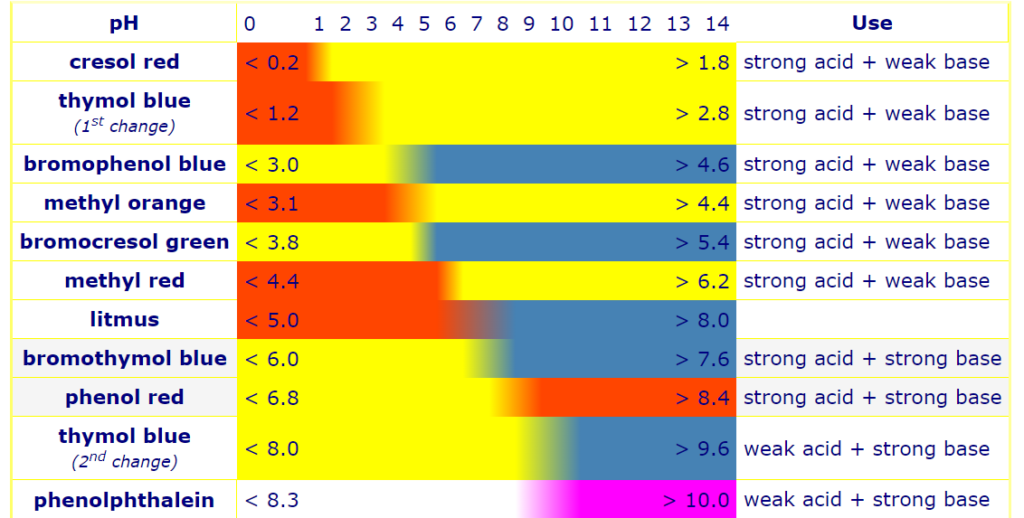
Required end point: At the desired endpoint of the titration, the indicator should change color. If the endpoint of the titration is the point at which the acid and base are neutralized, an indicator with a pK value near to 7 can be employed, such as bromocresol green. If the endpoint of the titration is the ratio of acid to base, an indicator with a pK value close to the desired ratio, such as methyl red, can be employed.
- Strong acid + strong base → salt (pH=7)Choose an indicator that changes colour at pH=7
- Strong acid + weak base → salt (pH < 7)Choose an indicator that changes colour at pH < 7
- Weak acid + strong base → salt (pH > 7)Choose an indicator that changes colour at pH > 7
Sensitivity of indicator: At the end of the titration, the indicator should change color noticeably. Some indicators, such as thymol blue, change color abruptly at the endpoint, whereas others, such as methyl orange, change color gradually.
Overall, the pH range of the titration, the desired endpoint, and the sensitivity of the indicator all influence the choice of an indication for an acid-base titration.
Indicators for different types of Acid-base Titration
Specific indication for different acid-base titrations: Acid-base titrations employ several indicators. The choice of indicators is determined by the type of titration and the range of the reaction.
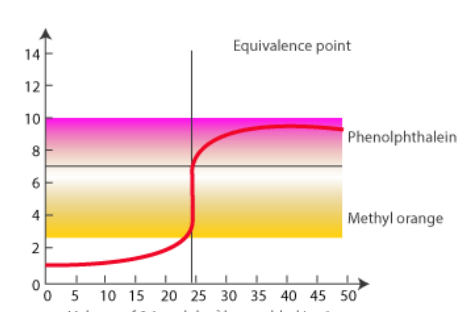
Strong acid-strong base titration: Phenolphthalein is often favored due to the easier visibility of color shift.
Weak acid-strong base titration: Phenolphthalein is preferred for this titration because to its sharp change at the equivalence point.
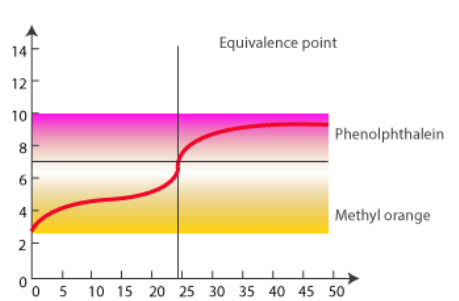
Strong acid-weak base titration: Methyl orange is preferred for this titration since it changes dramatically at the equivalence point.
Weak acid and weak base titration: There is no indication is adequate for this titration since a vertical section of the curve over two pH units is required.
Effects of Using the Wrong Indicator in an Acid-Base Titration
We can use bromothymol blue or phenol red as indicators for the titration of NaOH(aq) (a strong base) with HCl(aq) (a strong acid) because these indicators change color over a pH range that includes the pH of NaCl(aq) (the salt produced in the neutralization reaction):
HCl(aq) + NaOH(aq) → NaCl(aq) + H2O(l)
At the equivalence point, the only NaCl(aq) is present: NaCl(aq) has pH=7
Bromothymol blue changes color between pH 6.0 and 7.6
Phenol red changes color between pH 6.8 and 8.4.
Now, if we substituted a different indicator and use phenolphthalein instead.
Assume we’re mixing NaOH(aq) and HCl(aq) in a conical flask.
HCl(aq) + NaOH(aq) → NaCl(aq) + H2O(l)
Initially, there is a large excess of acid, the solution is acidic, and the phenolphthalein indicator is colorless.
At the equivalence point, the only NaCl(aq) is left ; NaCl(aq) has pH=7
Phenolphthalein changes color between: pH 8.3 and 10.0
so, at the equivalence point the phenolphthalein remains colorless.
We will have to add an excess of NaOH(aq) to the HCl(aq) to make phenolphthalein change color, in other words, the end-point as indicated by the indicator will occur only after the equivalence point for the acid-base reaction.
Titration Curve of Acid-base Titration
In titration, the equivalence point is reached when the same amount of hydroxide ions and hydrogen ions have been introduced. Titration is accomplished when the base from the burette is added and the acid is properly measured into a flask. Each titration curve has a unique shape that is exclusive to the acid-base titration.
The pH does not change consistently as the acid is administered. Each curve has horizontal sections where a high number of bases can be added without affecting the pH appreciably. With the exception of weak acid and weak base, when a single drop of base affects the pH by several units, each curve has a very steep section.
Despite the fact that the equivalence point is not at pH 7, there is a large pH change there. This influences the indicators chosen for each type of titration.
Titrations of Strong Acid and Strong Base
Here’s an example of a titration curve generated by a strong base when combined with a strong acid. This graph depicts how pH changes when 0.100 M NaOH is introduced to 50.0 mL of 0.100 M HCl.
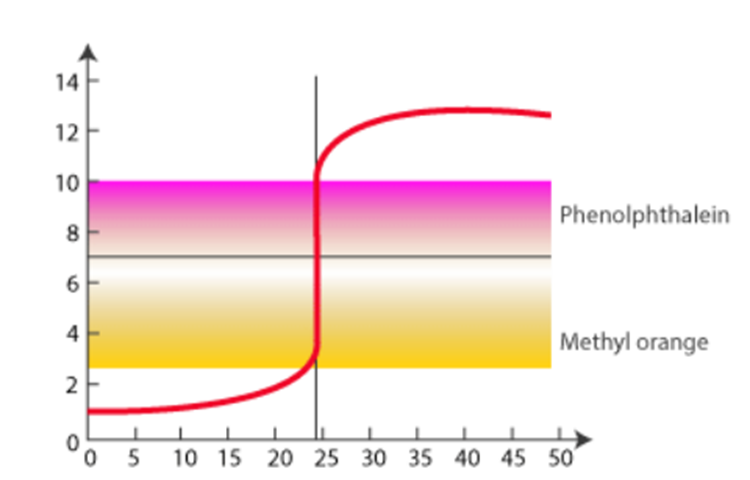
The titration’s equivalence point is the moment at which exactly enough titrant has been added to react with all of the item being titrated with no titrant remaining. In other words, the number of moles of titrant added thus far matches exactly to the number of moles of material being titrated according to reaction stoichiometry at the equivalence point. (Because there is a 1:1 acid:base stoichiometry in an acid-base titration, the equivalence point is the point at which the moles of titrant added equal the moles of substance initially in the solution being titrated.)
Titration of Weak Acid and Strong Base
In this case, 0.100 M NaOH is mixed with 50.0 mL of 0.100 M acetic acid.
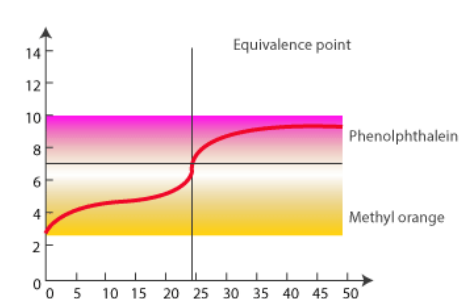
There are three significant differences between this curve:
- The starting pH of the weak-acid solution is greater.
- The pH rises more quickly at the beginning, but less quickly approaching the equivalence point.
- The equivalence point pH does not equal 7.00.
The pH of the equivalence point for a weak acid-strong base titration is more than 7.00. The pH of a strong acid-weak base or weak acid-strong base titration will vary rapidly at first, then gradually until it reaches the equivalence point. The slow slope is caused by the addition of a buffer solution, which resists rapid pH changes until the added acid or base surpasses the buffer’s capacity, at which point the quick pH change occurs around the equivalence point.
Titration of Strong Acid and Weak Base
There are three key differences between this curve as there are in the weak acid-strong base titration: (Note that the strong base-strong acid titration curve is the same as the strong acid-strong base titration curve, except it is flipped vertically.)
- The starting pH of the weak-acid solution is lower.
- The pH declines more quickly at the beginning, but less so near the equivalence point.
- The equivalence point pH does not equal 7.00.
The pH of the equivalence point for a weak base-strong acid titration is 7.00.
Titration of Weak Acid and Weak Base
Assume that the analyte is NH3 (weak base) and the titrant is acetic acid CH3COOH (weak acid). When we plot the pH of the analyte versus the volume of acetic acid added from the burette, we get the titration curve shown below.
There isn’t a single steep section in this plot. At the equivalence point, there is only what we call a “point of inflexion.” The lack of a steep shift in pH during the titration makes titration of a weak base versus a weak acid problematic, and such a curve contains little information.
Titration of Polyprotic Acid and Bases
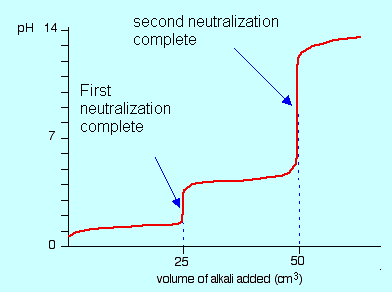
When titrating a polyprotic acid, there are frequently many equivalence points. When H2SO3 is titrated with NaOH, for example, there are two equivalence points that correspond to the two acidic protons in the H2SO3 molecule. There are also the same number of midpoints as equivalence points.
When a strong monoprotic base is given to a polyprotic acid solution, the neutralization reaction proceeds in steps. Titration begins with the most acidic proton (Ka,1), followed by the next most acidic (Ka,2), and so on. If the Ka values differ by at least three orders of magnitude, the entire titration curve will exhibit well-resolved “steps” corresponding to each acidic proton’s titration.
References
- https://collegedunia.com/exams/acid-base-titration-chemistry-articleid-7130#g
- https://unacademy.com/content/nta-ugc/study-material/pharmaceutical-analysis/types-of-acid-base-titrations-and-their-significance/
- https://studymind.co.uk/notes/titrations/
- https://byjus.com/chemistry/acid-base-titration/#Theory
- Quantitative Chemical Analysis, 7Ed. by Daniel C. Harris. Freeman and Company 2007.
- Freiser, H. (1963). Ionic Equilibria in Analytical Chemistry. Kreiger. ISBN 0-88275-955-8
- https://www.ausetute.com.au/indicata.html